High Earners Vs Low Earner & Credit Scores!

High Earners Vs Low Earner & Credit Scores!

Table of Contents

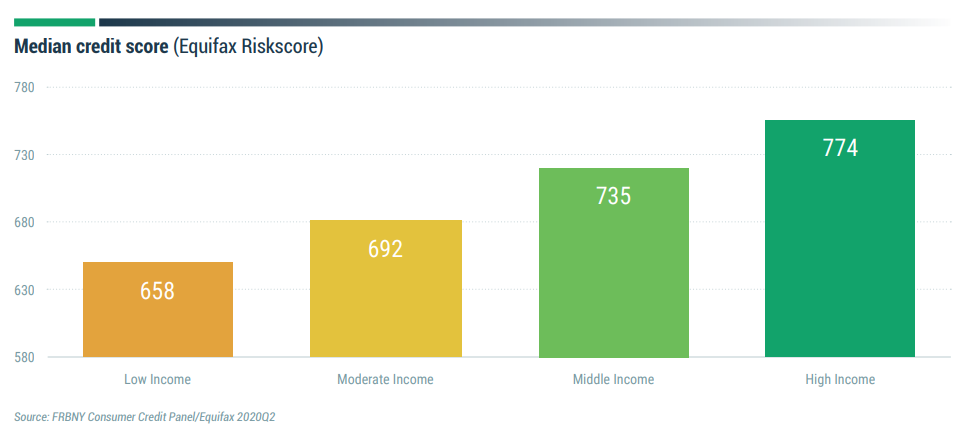
Did you know that when it comes to credit scores, usually higher earners have a higher score and lower earners have a lower score?

When it comes to credit scores and getting more credit, net-worth and how much you earn 100% effects this area of your life as well, in this article I want to focus on some of the credit score, rate and geographical differences we see between higher earners and lower earners.

It is definitely like what you would assume with much of this data, the more money you make the higher your score usually is and the lower income earners tend to fit into the sub-prime category. The last few years have been extremely good to CEOs and company founders while punishing the middle and low earners. We saw top tech CEOs from Bezos to Musk pull out record high amounts of money through 2021, while we saw record high amounts of small businesses close. 

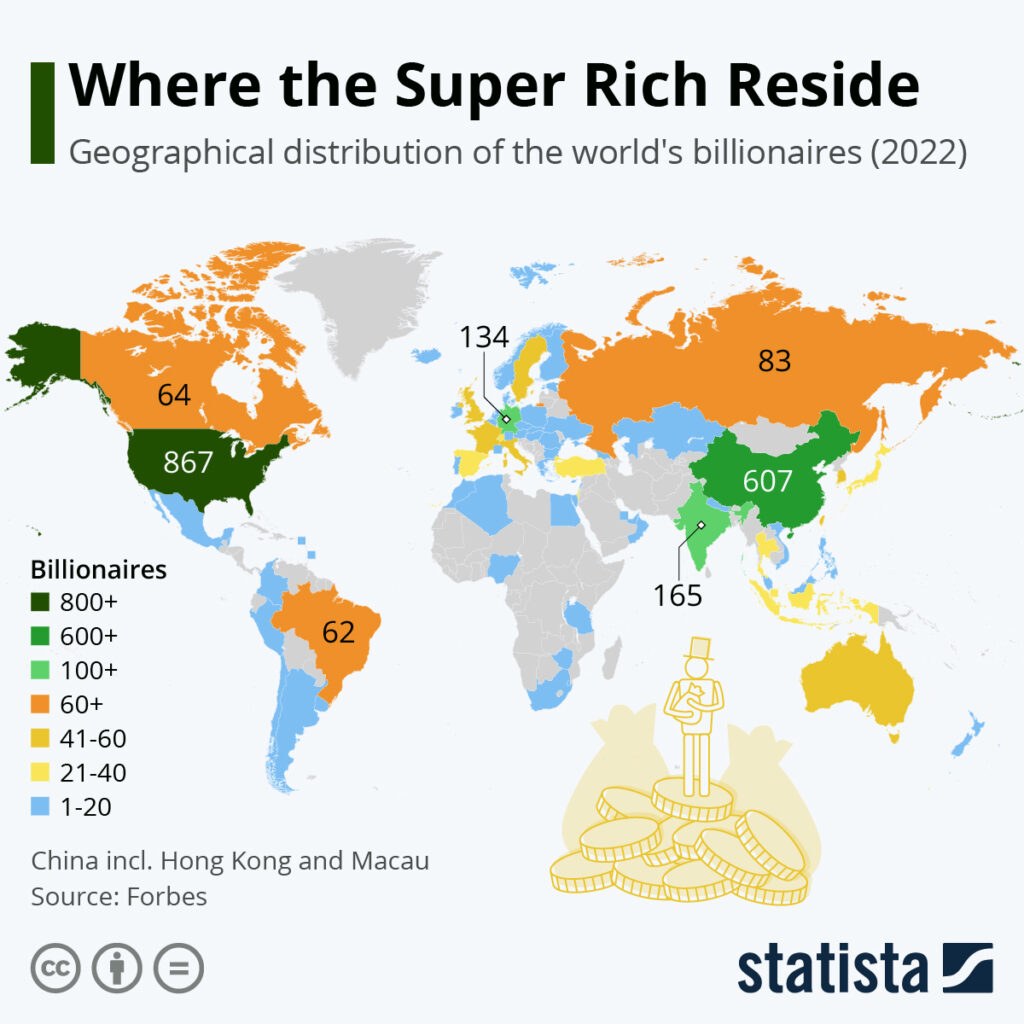
According to the Forbes Billionaires List of 2022, most of the world’s richest people are at home in the United States. As the Statista chart below shows, the country counted 867 billionaires per the list’s last release Tuesday. This is several more than the second-ranked country, China, with 607 and many more than in third-placed India with 165.

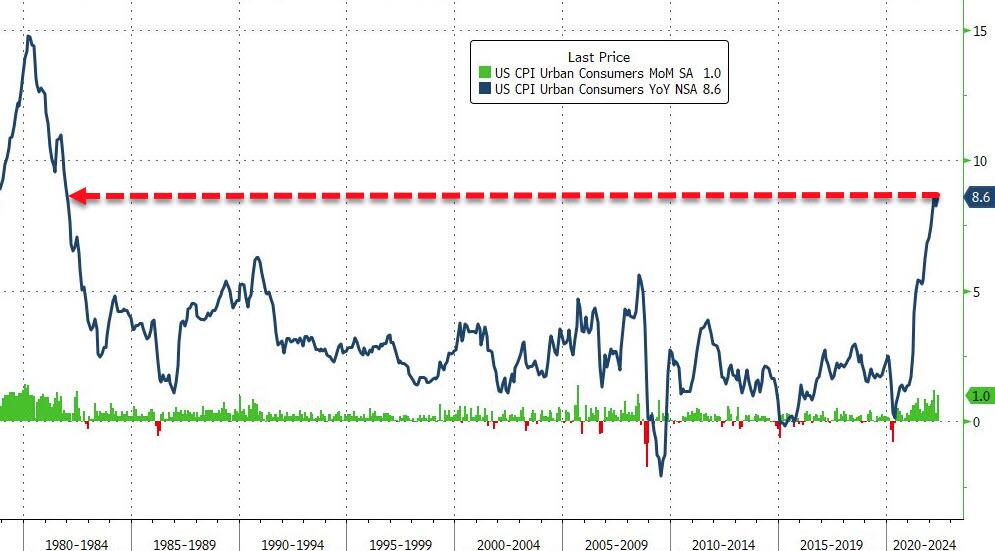
Inflation and money printing are two huge factors to inequality because it tends to push individuals up or down in terms of social structure. The last 2 years we have seen historic amounts of money printing and CPI we haven’t seen since 1981, the result of that is lower earners are pushed further down and higher earners are pushed higher up.

CPI data June 2022

Lets star with some overall stats that are great to see…

Average Credit Scores Are Going Up!

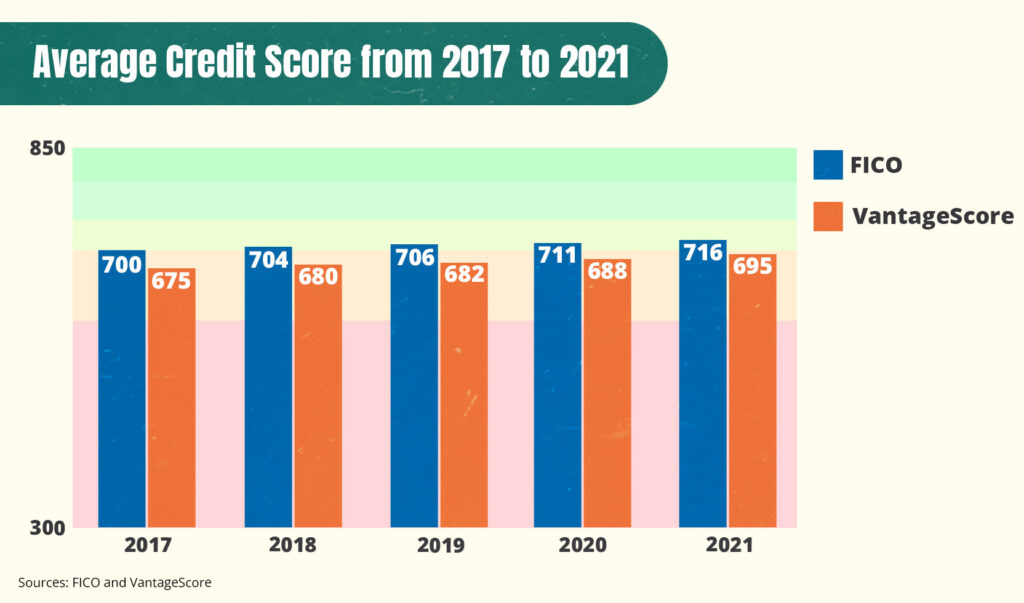
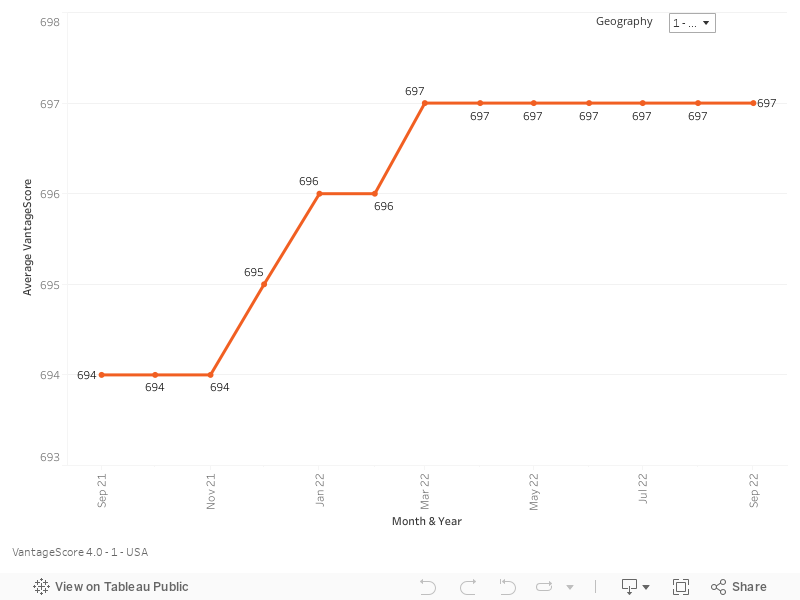
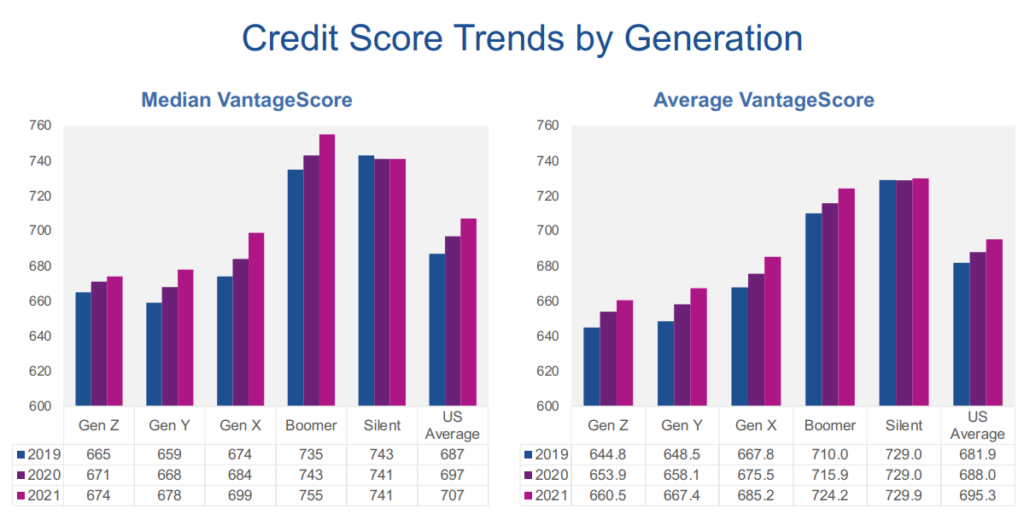
Currently, the average FICO score in the US is 716, and the average VantageScore credit score is 697, both of which are considered good credit scores.

The national average credit card utilization rate in 2021 is 25%, which is the lowest rate in at least a decade, that started in 2020.

67% of Americans Have A Good FICO Score

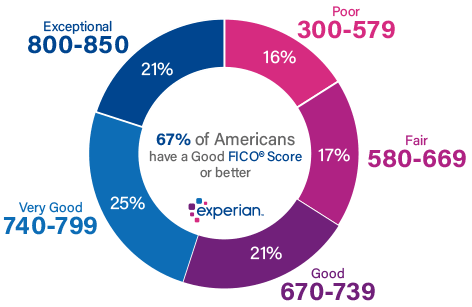
  • 21% of Americans have over an 800 credit score
  • 33% of Americans have a fair or poor credit score, putting them in subprime category
  • 67% of Americans have a good, very good or exceptional score

62.5% of Americans Have A Good VantageScore


High Net-worth & High Earners


High Net-worth Individuals Tend To Have A Higher Credit Score


High Earners Are More Likely To Have A Perfect Credit Score

High earners (those making $101,000–$150,000 per year) are more likely to have a perfect 850 FICO score than people in any other income group, according to Experian data. You see below the whole $76k-$250k range controls the majority of the perfect score positions.

It wasn’t always like this, for example in the fourth quarter of 2018, a little over 38% of perfect FICO® Scores were held by people with an estimated average annual income of $75K or less.

Obviously having more money will help you pay down usage in a more effective manner while being in a better position to weather economic storms but utilization is a big piece here not enough people talk about.

People With Higher Incomes Have Higher VantageScores & FICO Scores


1.6% of Americans Have A Perfect 850 Credit Score

As of April 2019, about 1.6% of the U.S. scorable population had an 850 FICO® Score. That compares to 0.98% in April 2014 and 0.85% in April 2009. This uptick shouldn’t be a surprise because in general credit scores are going up each year.

People with FICO® Scores of 850 carried an average 6.4 credit cards compared with the national average of 3.8 credit cards. When it came to credit card debt, however, Americans with perfect FICO® Scores owed less than half the U.S. average: an average $3,025 compared with the national average of $6,445.

Here is a breakdown of the states with the highest percentage of perfect FICO scores.

San Francisco Has The Highest Average FICO Score At 746

It should be no surprise that ‘silcon valley’ tops the list for highest credit score average.

California leads the way with the top 5 MSAs, San Francisco has the highest average FICO score at 746, followed by Minneapolis at 743 and Boston at 742. The San Luis Obispo-Paso Robles, California, area had the highest concentration of perfect FICO Scores, with 2.27% of its scores reaching 850, according to Experian data from the fourth quarter of 2018.

Those With Exceptional FICO Scores Have Just 5.7% Utilization

It is staggering to see the correlation in utilization rates between the poor credit rating and the exceptional credit rating. In 2021 this was about 58%, but that was with a 6.4% utilization rate, so its more like 68% difference in utilization between very poor scores and exceptional.

FICO Score RangeAverage Credit Utilization Rate
Very Poor (300–579)73%
Fair (580–669)51%
Good (670–739)32.6%
Very Good (740–799)12.4%
Exceptional (800–850)5.7%

Older Generations Have Both Higher FICO & VantageScores.

They are also the largest share of perfect credit scores 

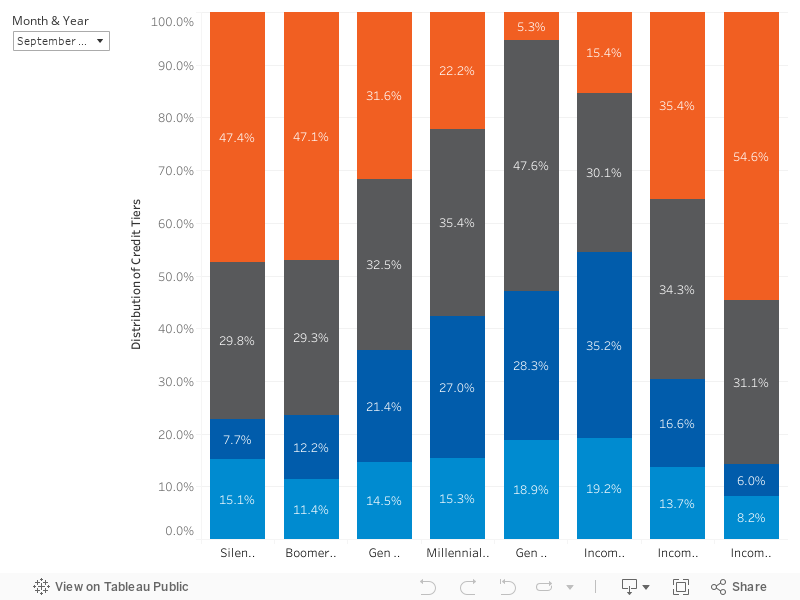
You can see in the chart below, the Boomer and Silent generation have the highest Vantage scores but this is also true for FICO. Baby boomers held the majority of perfect credit scores, accounting for 58% of people with an 850, according to Experian data from the fourth quarter of 2018. Generation X came next, accounting for 25% of people with perfect scores, and the silent generation trailed with 13% of the best scores.

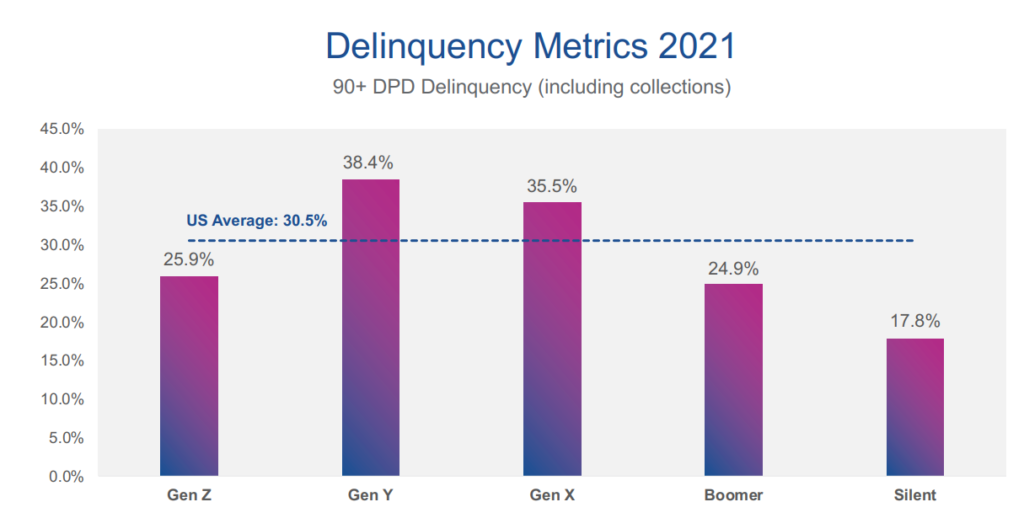
Older generations also carry the most amount of credit cards (boomers 3.4 average), Silent generation averages $3,821 credit card balances vs $7,236 for Gen X and have the lowest amount of delinquency/defaults according to 2021 Experian data.

Low Net-worth & Lower Earners

Now lets explore the other end of the spectrum which is the correlations between lower income and lower scores, which unfortunately when you slip into the sub-prime category because of the high APRs, most people find it very hard if not impossible to come back out. We can point back to the VantageScore Risk Tier and income class interactive chart above.

Low Net-worth Individuals Tend To Have Lower Credit Scores

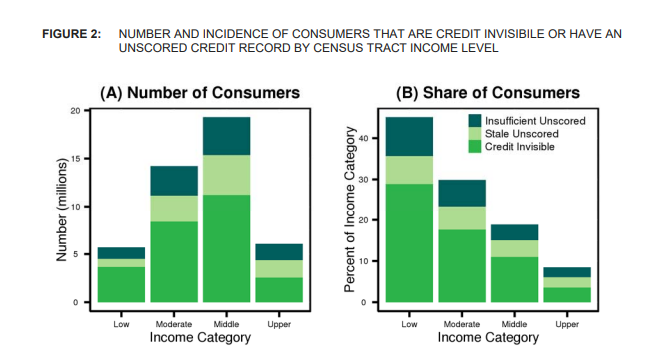
 Nearly 50% of low-income adults are credit invisible or not scorable.

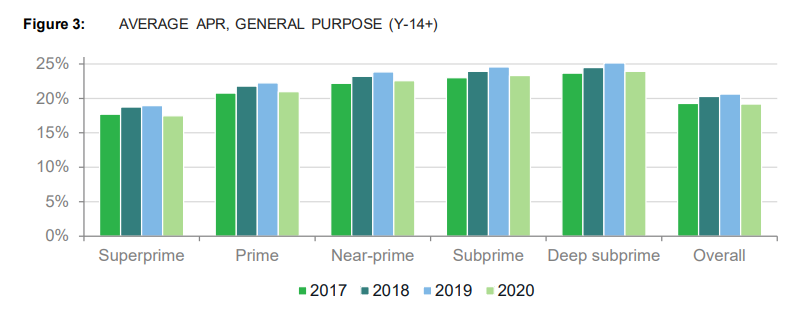
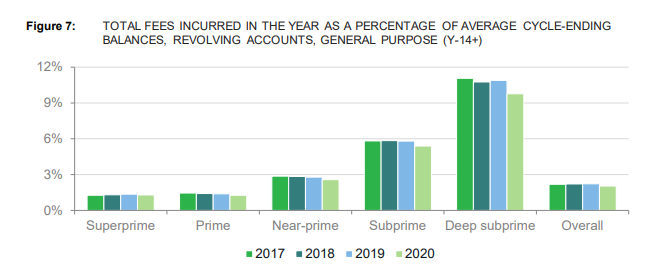
And low credit score individuals tend to pay more in fees…

total revolving credit fees

20% Of Adults Have Inactive Or Non-Existent Credit Files

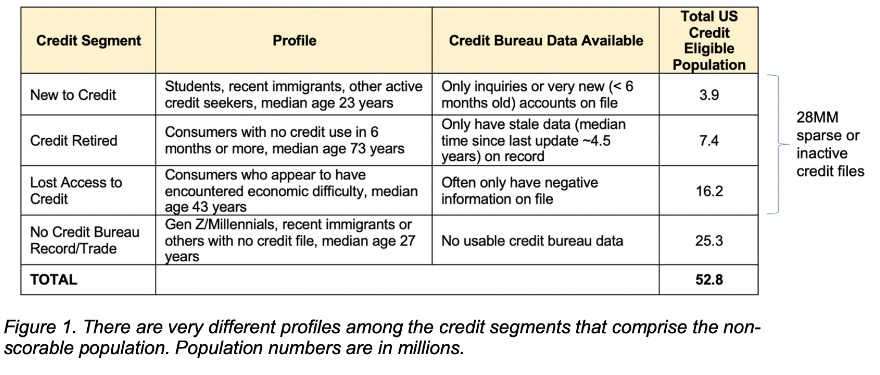
 So there is a total of 258M people according to Census data that are eligible for credit, out of that 232M people can be scored by FICO, which leaves out roughly 53M people who have only scant credit bureau data or no data at all. Finally out of that 53M people, 25M of them are what’s called ‘credit invisible’, with no credit bureau record at all.

This means either no credit score, no credit history or inactive credit files.

According to VantageScore, 37M more consumers are scorable with Vantage3.0 and 4.0 scoring models, that were previously invisible using ‘legacy models’. 13M of these consumers have VantageScore credit scores of 620 or higher;

11% Of Americans Have No Credit History & 8.3% Have No Score

The Consumer Financial Protection Bureau (CFPB) found that in 2010, 26 million adults in the US were “credit invisible” (meaning they had no credit files or records of credit activity at all), accounting for approximately 11% of the adult population.

In 2010, 19M adults were “unscorable” due to an insufficient credit history (too few credit accounts or not enough recent account activity) according to the CFPB.

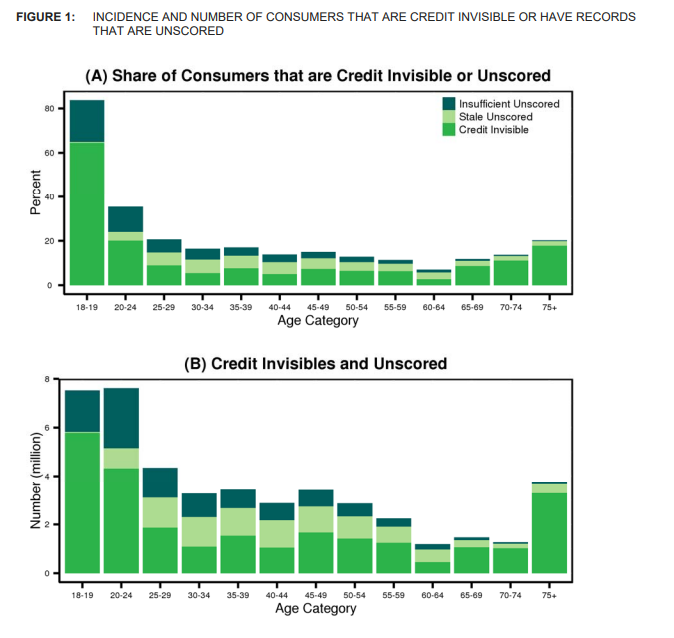
As shown, over 80% of 18 or 19 year old’s are credit invisible or have unscored records. This
percentage drops substantially for older consumers, falling below 40% in total for the 20
to 24 year old age group. After age 60, the number of consumers that are credit invisible or that
have an unscored record increases with age.

Higher Utilization Leads To Lower Scores

People with very poor FICO scores (300–579) have an average credit utilization rate of 73%.This puts them in the sub-prime category which means if they even get approved, it puts them in the worst APR possible.

FICO Score RangeAverage Credit Utilization Rate
Very Poor (300–579)73%
Fair (580–669)51%
Good (670–739)32.6%
Very Good (740–799)12.4%
Exceptional (800–850)5.7%

Lower Scores & Lower Income Lead To Higher Delinquency Rates

This should come as no surprise but whatever came first the low income or low score, the other usually is usually close by and so is defaulting on loans and credit card obligations.

Gen Z has the largest number of sub-prime with 29% according to VantageScore 2022 data, and income between 0-$49k was 29.4% sub-prime.

Delinquency rates in low income communities almost twice as high for most products as shown below in Q2 2019 data.

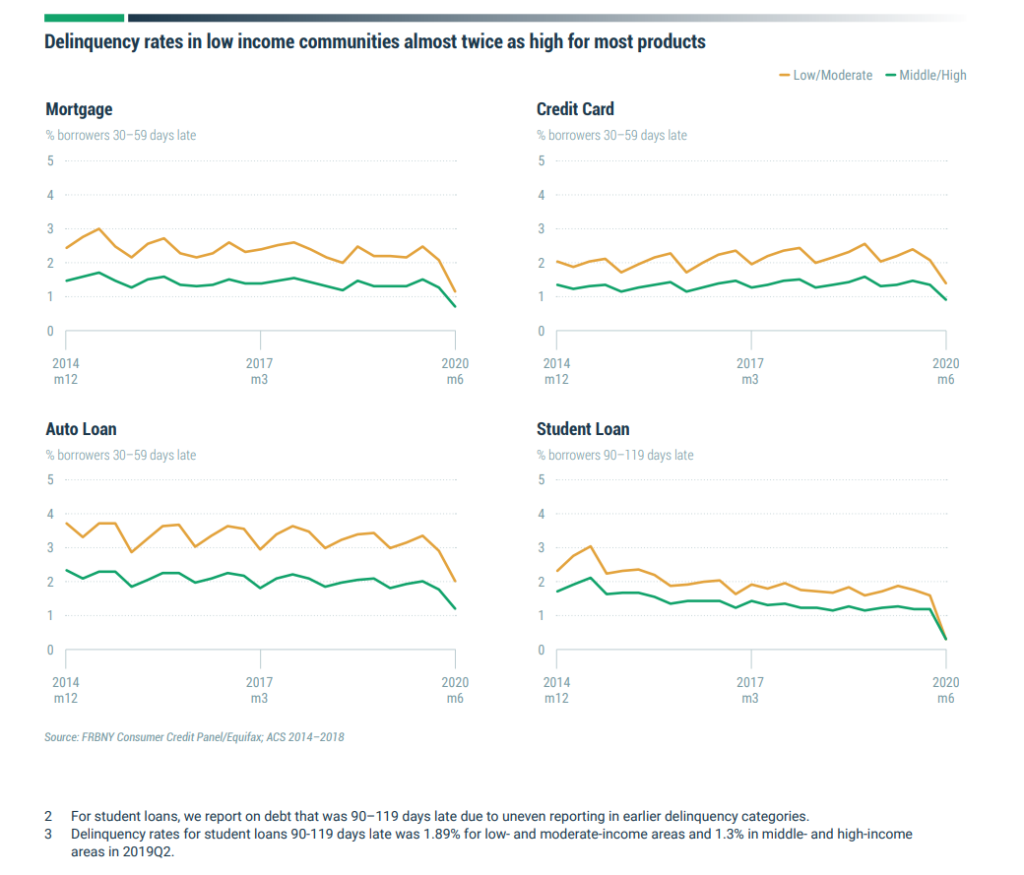
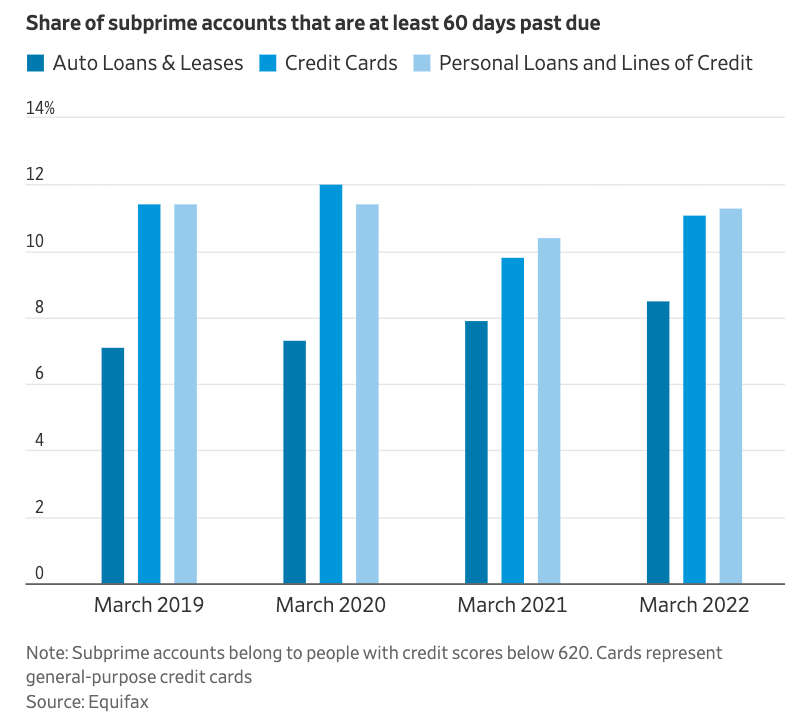
This is the most recent sub-prime delinquency data I could find which is up to March 2022.

  1. https://www.newyorkfed.org/medialibrary/media/outreach-and-education/community-development/the-state-of-low-income-america-credit-access-debt-payment
  2. https://files.consumerfinance.gov/f/documents/cfpb_consumer-credit-card-market-report_2021.pdf
  3. https://files.consumerfinance.gov/f/documents/cfpb_data-point-credit-invisibles_2015-05.pdf
  4. https://vantagescore.com/lenders/tools-and-resources/consumer-credit-insights
  5. https://www.vantagescore.com/wp-content/uploads/2022/03/Vantage_Invisibles1pager-UPDATED-@-6.14.pdf
  6. https://vantagescore.com/blog_type/research/
  7. https://www.fico.com/blogs/perfect-credit-score-understanding-850-fico-score
  8. https://www.fico.com/blogs/more-232-million-us-consumers-can-be-scored-fico-score-suite
  9. https://www.fico.com/en/resource-access/download/37861
  10. https://www.experian.com/blogs/ask-experian/state-of-credit-cards/
  11. https://www.experian.com/blogs/ask-experian/perfect-scores-who-has-them-and-what-do-they-have-in-common/
  12. https://images.go.experian.com/Web/ExperianInformationSolutionsInc/%7Ba3ff8e50-5e52-4920-9a37-397bb0244d32%7D_SOC2021_09012021.pd

Have Questions?

Jump on over to our discord and continue the conversation or ask questions about the above dataset! 

Gain Access To Premium Credit Datasets & Courses!

We have rebranded from Its Dumb Money to Wallet Monkey! Same mission, new name!