Recently a lot of macro economic data was released, this is usually a monthly or quarterly thing where we can use this data to get insight into what the broader market participants are doing. I think that is probably why most people don’t really care for data like this, is because they are not sure what to do with it.
At minimum we can get a good read into what is happening with the broader consumer credit market and see how over extended or under extended it is. That when we pair it with other data like sentiment and personal savings rates, gives us a great edge, because we see how everyone else is positioned. Again this gives us a huge edge. This data becomes even better when you pair it with our new credit score requirements cheat sheet.
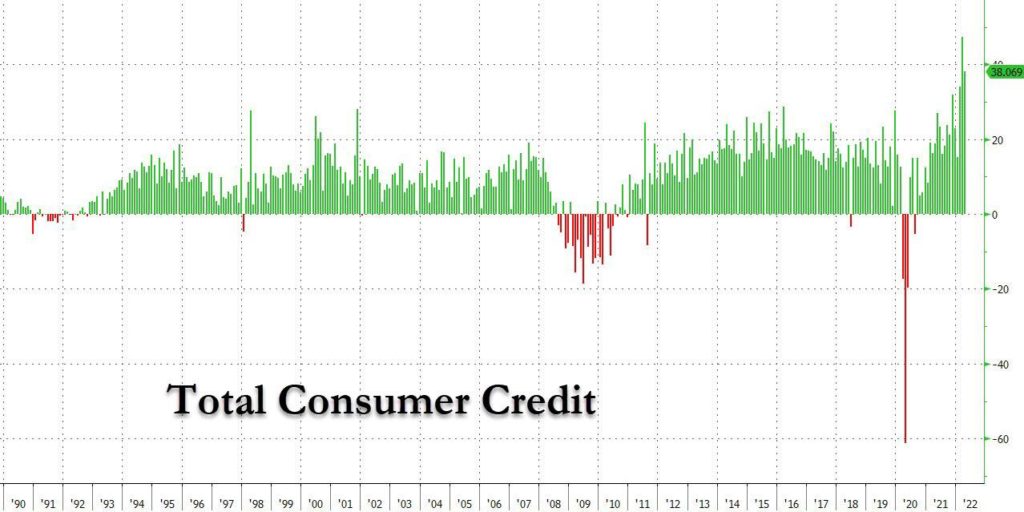
Total Consumer Credit
On this chart you will see this is the 2nd highest level we have seen since 1990 when the data started.
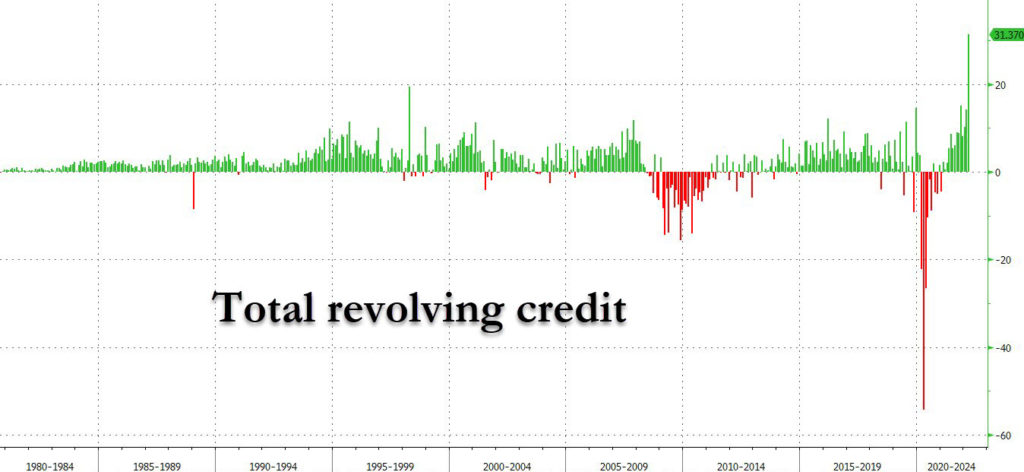
Total Revolving Credit
Total revolving credit or credit that you can pay down and use again hit an all time high.
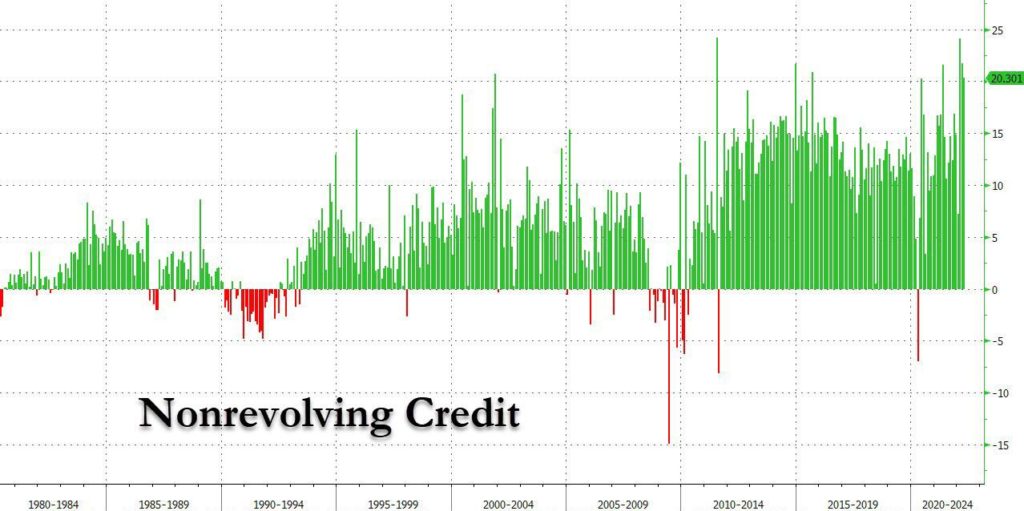
Total Non-Revolving Credit
Non-revolving credit is everything else, like a loan, mortgage, heloc, aloc etc. Its up there in the top one percentile for sure but not an all time high.
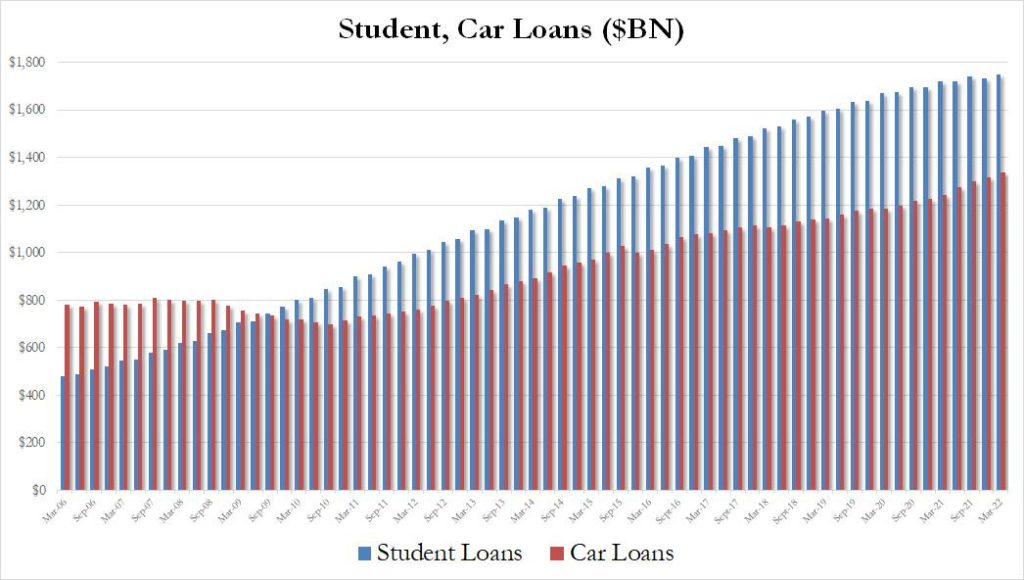
Total Auto & Student Loan Debt
The upward trend since 2008 continues on both fronts.
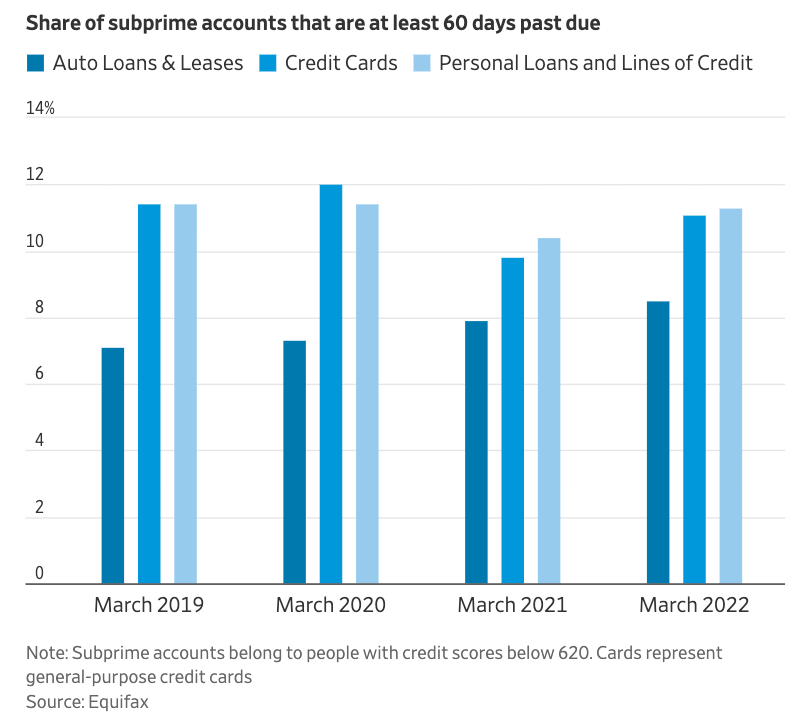
We can see the bottom starting to fall out on subprime delinquencies again.
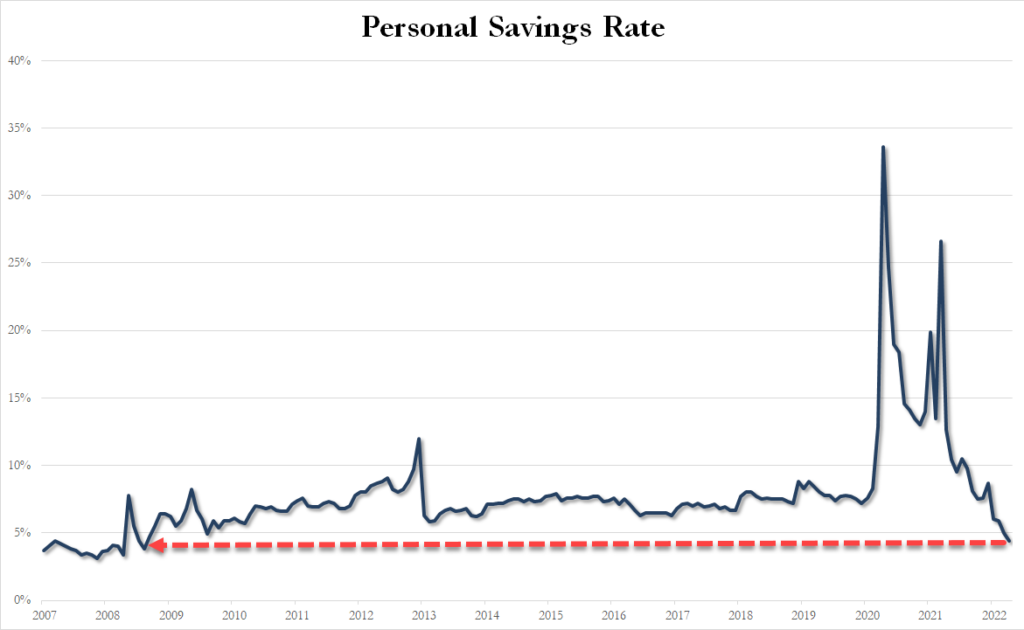
Personal Savings Rate
Now you might be thinking some of this money is getting dumped into savings right? Well probably not if we are looking at this chart, which is as of May 2022.
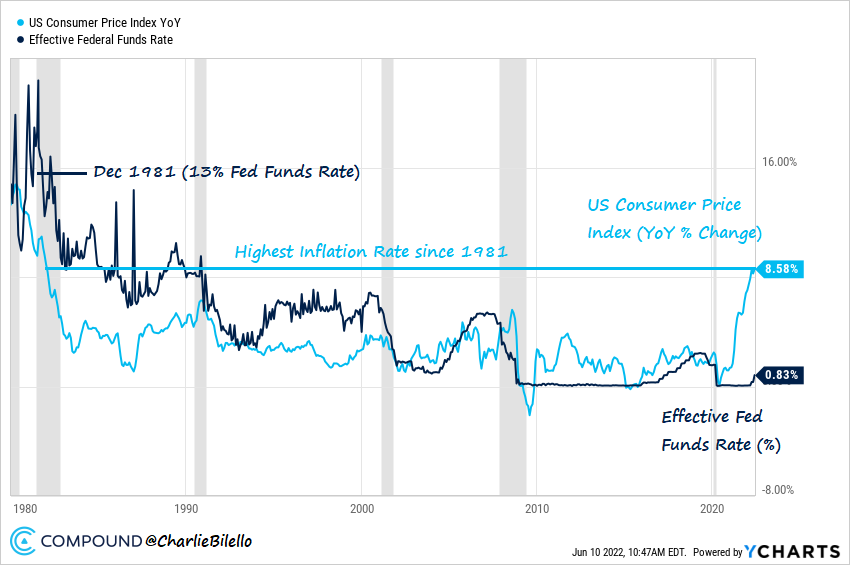
Fed Funding Rate & Inflation
Now, lets add more on top here! This is the Fed Funding rate (Interest rate) and the CPI (inflation) laid on top each other. Right now the markets are pricing in 10 more rate hikes and 3 rate cuts after that.
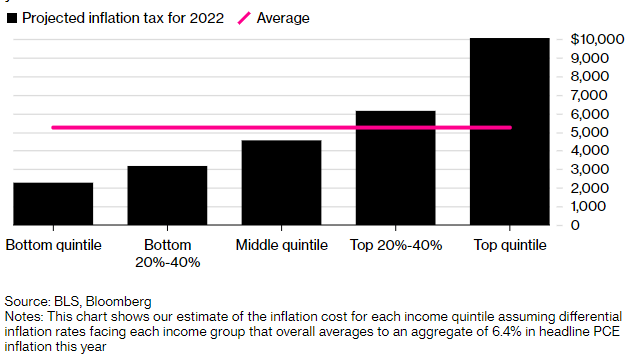
Speaking of inflation, this is from a recent Bloomberg piece where they have attempted to figure out how much money this inflation will cost the typical household over this year.
Now if we consider the fact that inflation has eroded away about 2.4% pay during 2021, talking about this year, Bloomberg economists estimated the average household will pay an additional $5,200 this year ($433 per month) compared to last year for the same consumption basket.
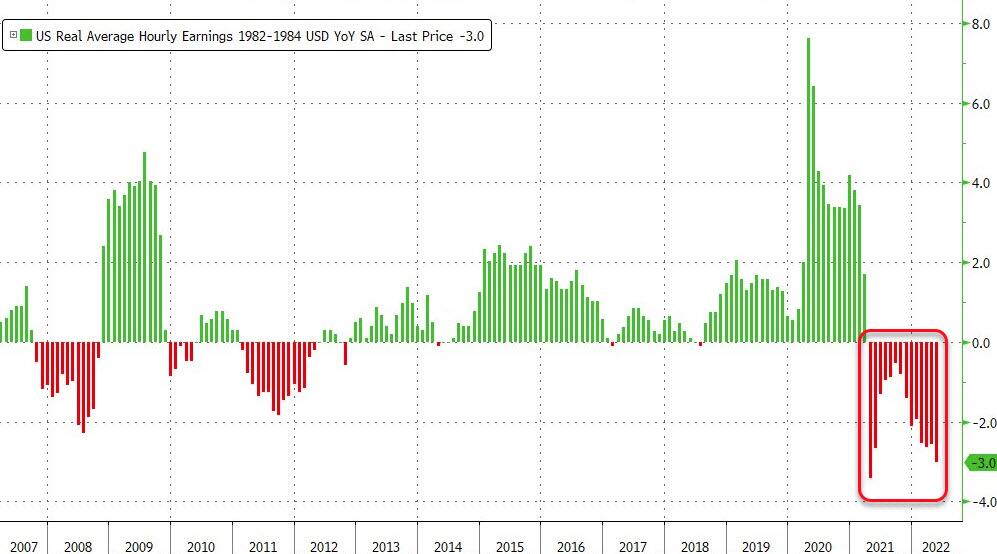
You can further see the damage done to hourly wages in this chart below
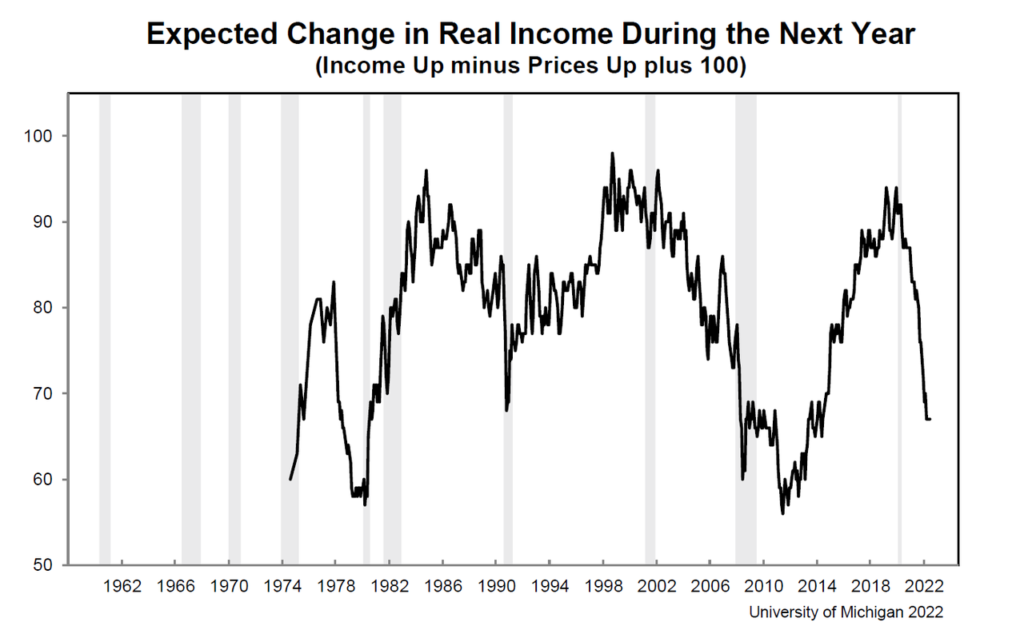
Lastly lets look at expectations of earnings over the next 12 months